Important Note!
We use cookies to ensure you get the best experience on our website.
By clicking ‘Agree,’ you accept our use of cookies as outlined in our cookies policy

Gold (XAUUSD) remains in an important corrective phase on the H4 timeframe after the market experienced a sharp decline from the recent high around the 4670–4680 area.
The current chart suggests that the decline may have completed an initial Wave A, followed by a corrective recovery in Wave B. Price has subsequently pulled back toward the lower support area, creating the possibility that the market is now preparing for the next upward leg of the correction, identified as Wave C.
The main projection on the chart points toward the 261.8 Fibonacci extension, which represents the potential target zone for Wave C.
Therefore, the current setup is focused on whether gold can maintain the developing bullish structure and complete the projected ABC correction toward the upper Fibonacci target.
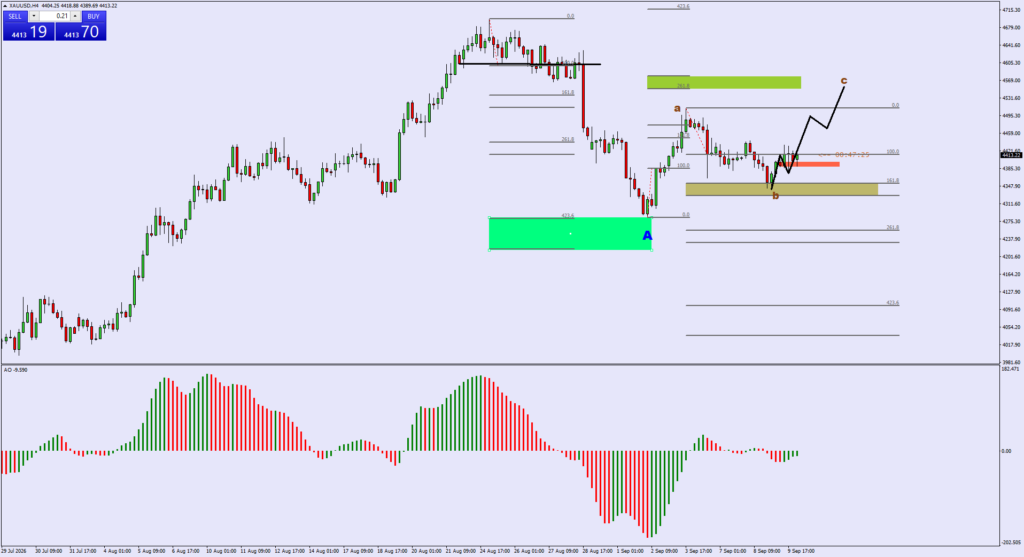
The larger price structure shows a significant decline from the recent high.
Following that decline, the chart identifies the first major corrective movement as Wave A. Price then recovered toward the 4490–4500 area, forming the potential Wave B.
After reaching the Wave B area, gold experienced another decline toward the 4350 region, where the chart marks the potential completion of the Wave B correction.
The current structure can therefore be interpreted as:
Wave A → Wave B → developing Wave C
If this count remains valid, the next important movement would be an impulsive advance forming Wave C.
The projected Wave C path on the chart indicates an initial rise toward the previous reaction high, followed by a possible short-term pullback before another stronger move higher.
Wave B Support Area
The current price action is developing around an important Fibonacci support region.
The chart shows the Wave B area near the 161.8 Fibonacci level, with another important support zone positioned lower around the 261.8 Fibonacci extension.
This area is important because Wave B needs to establish sufficient support before Wave C can develop properly.
Recent candles show that sellers have struggled to push price significantly lower after the decline into the support region.
If buyers continue to defend this area, the probability of a recovery toward the Wave C projection will increase.
However, confirmation is still required because price remains below several important resistance levels.
The black projection on the chart outlines the expected Wave C structure.
The first stage would be a continuation higher from the current region toward approximately the 4490–4500 resistance area.
Once price reaches that level, a short-term pullback may occur before the next bullish leg develops.
This pullback would not necessarily invalidate the bullish scenario.
Instead, it could represent an internal correction within Wave C before the market resumes its upward movement.
The projected structure is therefore:
Current support → recovery → resistance near 4490–4500 → short-term pullback → stronger Wave C advance.
A successful continuation after the pullback would strengthen the overall ABC correction scenario.
The major target highlighted on the chart is the 261.8 Fibonacci extension, located around the 4560–4580 region.
This is the most important upside target in the current setup.
If Wave C develops as projected, price could eventually move toward this zone.
The 261.8 extension is particularly significant because it represents a larger Fibonacci projection of the preceding corrective structure.
Therefore, traders should pay close attention to price behaviour as XAUUSD approaches this area.
A strong bullish move into the 261.8 zone would support the completion of the projected Wave C structure.
On the other hand, a sharp rejection from the target zone could indicate that the corrective rebound is reaching exhaustion.
Although the chart presents a bullish Wave C projection, gold still has several resistance levels that need to be overcome.
The first important resistance is around the 4490–4500 region, corresponding to the previous Wave B high and nearby Fibonacci levels.
This area could produce a temporary rejection.
Therefore, it would not be unusual for gold to move higher first and then experience a short-term pullback before continuing toward the larger target.
The projected path shown on the chart reflects exactly this possibility.
A pullback that remains above the important Wave B support would keep the bullish corrective scenario intact.
The Awesome Oscillator (AO) is currently still below the zero line, reflecting the weakness created by the previous sell-off.
However, the recent AO bars are showing signs of recovery, with the negative histogram beginning to contract.
This is an important development.
The reduction in negative momentum suggests that bearish pressure may be losing strength.
If AO continues moving higher and eventually crosses above the zero line, it would provide additional confirmation that bullish momentum is returning.
However, AO should be used together with price structure rather than as a standalone signal.
The most important confirmation remains whether price can establish a higher low and break the nearby resistance levels.
The preferred scenario from the current chart is for gold to continue developing the Wave C recovery.
The expected sequence is:
Wave B support holds → price rises toward 4490–4500 → short-term pullback → bullish continuation → Wave C toward 261.8 target.
If price successfully breaks above the previous Wave B high, the probability of a larger Wave C advance would increase.
A sustained move above the resistance area would also confirm that the current recovery is gaining structural strength.
The major upside objective remains the 261.8 Fibonacci target around 4560–4580.
The bullish scenario would become weaker if price fails to hold the important support area and begins producing new lower lows.
A decisive breakdown below the Wave B support structure would suggest that the current interpretation of the ABC correction needs to be reconsidered.
In that situation, the expected Wave C advance could be invalidated or significantly delayed.
Therefore, traders should not assume that every recovery will automatically reach the 261.8 target.
The key is whether the current support structure remains protected.
For now, XAUUSD H4 has a bullish corrective bias, with the chart suggesting that the market may be developing Wave C following the completion of the previous A-B movement.
The immediate objective is to watch how price behaves around the 4490–4500 resistance zone.
A breakout and successful retest of this area would provide stronger confirmation for continuation toward the higher target.
If a pullback occurs before the breakout, the correction should be monitored carefully. As long as the pullback remains within the expected structure and does not invalidate the Wave C scenario, it could provide another opportunity for the bullish structure to develop.
The major target remains the Fibonacci 261.8 zone around 4560–4580.
XAUUSD H4 is currently showing a potential ABC corrective structure, with Wave A having developed during the previous sharp decline, Wave B forming the subsequent recovery and pullback, and Wave C now potentially beginning from the current support region.
The recent improvement in the Awesome Oscillator suggests that bearish momentum is gradually weakening, supporting the possibility of a recovery.
The first major level to monitor is the 4490–4500 resistance zone. A successful breakout would strengthen the bullish scenario and open the path toward the projected 261.8 Fibonacci target around 4560–4580.
The overall roadmap is therefore:
Wave B support → Wave C recovery → 4490–4500 resistance → possible pullback → bullish continuation → 261.8 Fibonacci target.
For now, the bias remains bullish for the corrective Wave C scenario, while the key support structure should be protected to maintain this outlook.


AUDUSD continues to maintain a bullish Elliott Wave structure on the Weekly timeframe.

The EURUSD H4 chart shows a developing bullish Elliott Wave structure following the completion of a significant corrective decline.

Get the FXGT App


