Important Note!
We use cookies to ensure you get the best experience on our website.
By clicking ‘Agree,’ you accept our use of cookies as outlined in our cookies policy

The EURUSD H4 chart shows a developing bullish Elliott Wave structure following the completion of a significant corrective decline. Price appears to have established a major Wave II low, after which the market began a strong recovery and formed a sequence of higher highs and higher lows.
The current structure suggests that EURUSD may be progressing through the early stages of a larger Wave III, with the shorter-term wave count indicating that an internal corrective phase may occur before the next bullish expansion.
The chart therefore presents a bullish medium-term bias, provided the highlighted support area continues to hold.
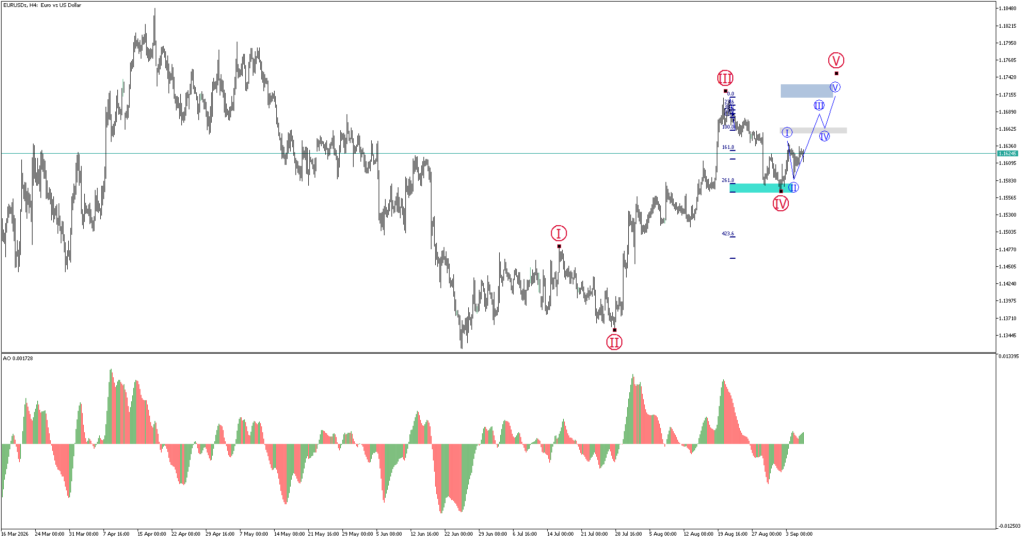
From the Elliott Wave perspective, the larger structure appears to have completed Wave I and Wave II, with Wave II ending near the 1.1340–1.1360 region. Since that low, EURUSD has produced a strong upward movement, indicating a potential transition into Wave III.
The recent price action is particularly important because the market has already broken away from the previous consolidation structure and moved toward the 1.16 region.
The current wave count suggests that the first portion of Wave III is developing into smaller internal waves:
The blue projection on the chart indicates that the market could experience a pullback before continuing higher. This is consistent with the expected behaviour of an Elliott Wave impulse, where corrective waves periodically appear before the next directional expansion.
The turquoise zone around 1.1570–1.1590 is an important area to monitor.
This zone sits close to the Fibonacci retracement structure shown on the chart and may provide support if the expected Wave IV correction develops.
A successful reaction from this area would strengthen the bullish scenario.
However, traders should avoid assuming that every pullback will immediately reverse higher. Price should ideally show bullish confirmation around the support zone before considering continuation setups.
The Fibonacci measurements on the chart provide several potential upside reference levels.
The first important objective is around the 1.1660–1.1680 area, which corresponds to an intermediate resistance zone.
If price successfully breaks through this region and establishes support above it, the next upside objective becomes the higher blue resistance zone around 1.1720–1.1750.
This area is significant because it coincides with the projected completion of the larger Wave V.
Therefore, the projected path can be summarised as:
Wave IV pullback → Wave V recovery → break of intermediate resistance → final target zone.
The Awesome Oscillator also provides supporting evidence for the bullish recovery.
After the oscillator moved into negative territory during the corrective phase, it has started to recover and move back toward the zero line. The latest histogram bars are turning positive, indicating that bullish momentum is beginning to return.
This is important because a continued increase in positive AO readings would support the possibility of further upside momentum.
However, if price rises while the AO begins to weaken significantly, traders should remain alert to a potential bearish divergence or a deeper corrective structure.
The preferred scenario is that EURUSD completes the expected Wave IV correction while remaining above the key support zone.
If the support area holds and bullish momentum returns, the market could begin developing Wave V.
A break above the recent high would provide additional confirmation that the correction has ended and that the next impulsive leg is underway.
The projected upside path is toward:
1.1660–1.1680 → 1.1720–1.1750
The higher zone represents the main target area for the current Elliott Wave structure.
Although the chart currently favours the bullish scenario, the wave count remains invalid if price breaks decisively below the important support structure.
A sustained break below the turquoise support zone would weaken the expectation of an immediate Wave V advance and could indicate that the corrective phase is more complex than initially expected.
In that situation, traders should reassess whether the current Wave IV is developing into a deeper correction before attempting another bullish continuation.
Therefore, support confirmation is more important than simply buying based on the projected Elliott Wave count.
The EURUSD H4 structure currently favours a bullish Elliott Wave continuation, with the market potentially developing the final stages of an internal impulsive sequence.
The key area to monitor is the highlighted 1.1570–1.1590 support zone. A successful bullish reaction from this area could provide the foundation for another advance toward 1.1660–1.1680, followed by the larger projected target around 1.1720–1.1750.
The overall roadmap is therefore:
Wave IV correction → support confirmation → Wave V advance → 1.1720–1.1750 target zone.
As always, the Elliott Wave projection should be treated as a scenario rather than certainty. Price behaviour around the highlighted support and resistance zones will determine whether the bullish structure remains valid.


AUDUSD continues to maintain a bullish Elliott Wave structure on the Weekly timeframe.

Gold (XAUUSD) is currently showing signs of a potential recovery after experiencing a sharp corrective decline from the recent high area.

Get the FXGT App


