Important Note!
We use cookies to ensure you get the best experience on our website.
By clicking ‘Agree,’ you accept our use of cookies as outlined in our cookies policy

AUDUSD continues to maintain a bullish Elliott Wave structure on the Weekly timeframe. Based on the chart, the previous corrective phase appears to have completed at Wave IV, followed by a strong recovery that suggests the market is now developing Wave V.
The current structure is particularly important because AUDUSD is approaching the previous major high. A breakout above this level would open the possibility for price to establish a new high, with the 261.8 Fibonacci extension identified as the major upside target.
At the same time, the Awesome Oscillator (AO) is showing an interesting momentum structure. Although price continues to recover, momentum has not yet produced a comparable high to the previous bullish cycle. This creates the potential for a bearish divergence once price reaches a new high.
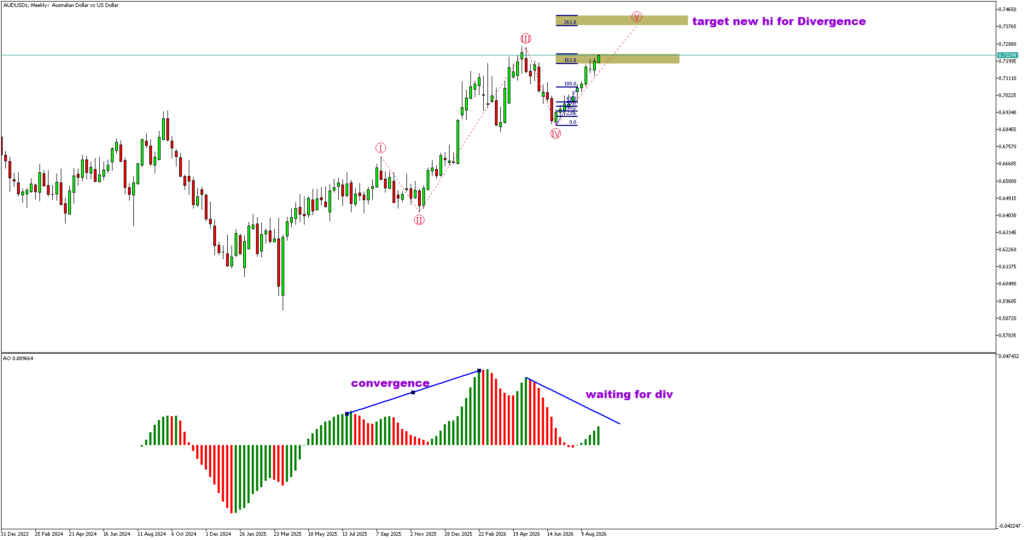
The larger structure on the chart indicates a five-wave bullish sequence.
The market initially developed Wave I, followed by a corrective Wave II. This was then followed by a much stronger bullish movement in Wave III.
After Wave III reached its peak, AUDUSD entered a corrective Wave IV. The correction eventually found support and price began another bullish advance.
The current interpretation is therefore:
Wave I → Wave II → Wave III → Wave IV → developing Wave V
The completion of Wave IV is important because it provides the structural foundation for the current bullish scenario.
As long as the Wave IV low remains intact, the possibility of Wave V continuing toward a new high remains valid.
The current price movement suggests that AUDUSD is still in the process of developing Wave V.
Price has already recovered substantially from the Wave IV low and is now approaching the previous Wave III high.
A sustained breakout above that previous high would be an important confirmation that Wave V is continuing.
However, the objective is not simply to break the previous high.
The chart suggests that price could continue toward a new high around the 261.8 Fibonacci extension, where the market may potentially begin showing signs of exhaustion.
This makes the next phase particularly important because the bullish movement itself could eventually provide the conditions for a bearish reversal.
The main target highlighted on the chart is the 261.8 Fibonacci extension, located around the 0.74 region.
This level represents the projected target area for the current Wave V.
The 261.8 extension is particularly significant because it can act as a potential completion zone for an extended impulsive wave.
Therefore, if AUDUSD continues higher, traders should pay close attention to the behaviour of price around this region.
A move into the target zone accompanied by strong momentum would indicate that the bullish structure is still developing.
However, if price reaches the target while momentum fails to confirm the new high, the probability of Wave V exhaustion would increase.
The Awesome Oscillator provides an important additional confirmation tool for this Elliott Wave analysis.
During the previous bullish movement, AO reached a significant positive peak. The current recovery is also producing positive momentum, but the structure suggests that momentum may not be reaching the same strength as the previous major advance.
The chart specifically highlights “convergence” followed by “waiting for div.”
This indicates that the current bullish movement is still developing, but the expected bearish divergence has not yet been fully confirmed.
The ideal divergence scenario would be:
Price makes a higher high → AO makes a lower high → bearish divergence develops.
If this occurs near the projected 261.8 target, it would provide a stronger warning that Wave V may be approaching completion.
The previous Wave III high is an important structural reference.
If AUDUSD breaks above that level, the market would establish a new higher high and confirm continued bullish strength.
However, this new high could also become the location where bearish divergence develops.
This is why the chart identifies the projected target as:
“target new hi for Divergence.”
The idea is not to predict a reversal before the market reaches the new high.
Instead, the preferred approach is to allow price to complete the bullish move first and then evaluate whether momentum confirms the new high.
If price makes a new high but AO remains below its previous peak, the divergence becomes significantly more meaningful.
The primary scenario remains bullish.
AUDUSD could continue higher from the current structure and eventually break above the previous Wave III high.
The expected path would be:
Wave IV completion → Wave V advance → breakout of previous high → new high → 261.8 Fibonacci target.
As long as the market maintains its bullish structure and the Wave IV low remains protected, there is no strong structural reason to abandon the Wave V scenario.
A sustained weekly breakout above the previous major high would further strengthen this outlook.
The bearish scenario becomes more relevant once price reaches the projected new-high area.
If AUDUSD reaches the 261.8 target while AO produces a lower high, a bearish divergence could develop.
This would suggest that price is still rising, but the underlying momentum is weakening.
However, divergence alone should not immediately be treated as a sell signal.
The stronger confirmation would be:
New high → bearish divergence → rejection → break of short-term support → corrective movement.
Only after this sequence develops would the probability of a larger correction increase significantly.
The most important areas from the chart are:
Previous Wave III High
This is the immediate structural resistance that AUDUSD needs to overcome to confirm the continuation of Wave V.
261.8 Fibonacci Extension
This is the major projected target zone and potential area for Wave V completion.
Wave IV Low
This remains the critical structural invalidation area for the current bullish interpretation.
Awesome Oscillator
The relationship between the next price high and the previous AO peak will be crucial in determining whether bearish divergence develops.
From the current chart structure, the preferred outlook remains bullish toward the projected 261.8 target.
However, traders should avoid assuming that reaching the target automatically means an immediate reversal.
The more important confirmation will be the interaction between price structure and momentum.
If price continues making higher highs while AO also strengthens, Wave V could continue developing.
Conversely, if price makes a new high while AO forms a lower high, this would provide an important warning that the bullish cycle may be approaching exhaustion.
Therefore, the 261.8 area should be treated as a major observation zone, particularly for traders looking for a potential reversal setup.
AUDUSD remains bullish on the Weekly timeframe, with the Elliott Wave structure suggesting that Wave IV has likely completed and Wave V is currently developing.
The immediate focus is on a potential breakout above the previous Wave III high. If this occurs, AUDUSD could continue toward the 261.8 Fibonacci extension around the 0.74 region, establishing the new high anticipated in the chart.
At the same time, the Awesome Oscillator is showing signs that momentum may not be matching the strength of the previous bullish cycle. This creates the possibility of a bearish divergence once the new high is established.
Therefore, the overall roadmap remains:
Bullish Wave V → Break previous high → New high → 261.8 target → Potential bearish divergence → Possible larger correction.
For now, the bullish bias remains dominant, while the potential bearish divergence should be closely monitored as AUDUSD approaches the projected target zone.


The EURUSD H4 chart shows a developing bullish Elliott Wave structure following the completion of a significant corrective decline.

Gold (XAUUSD) is currently showing signs of a potential recovery after experiencing a sharp corrective decline from the recent high area.

Get the FXGT App


