Important Note!
We use cookies to ensure you get the best experience on our website.
By clicking ‘Agree,’ you accept our use of cookies as outlined in our cookies policy

USD/JPY remains structurally bullish on the weekly timeframe, with the current price action appearing to develop a corrective phase within a larger impulsive structure.
The Elliott Wave count suggests that the market may have completed Subwave (i) within a larger bullish Wave 3, while the current decline could represent the beginning of Subwave (ii).
The projected correction is expected to unfold as an ABC structure before the next bullish expansion resumes.
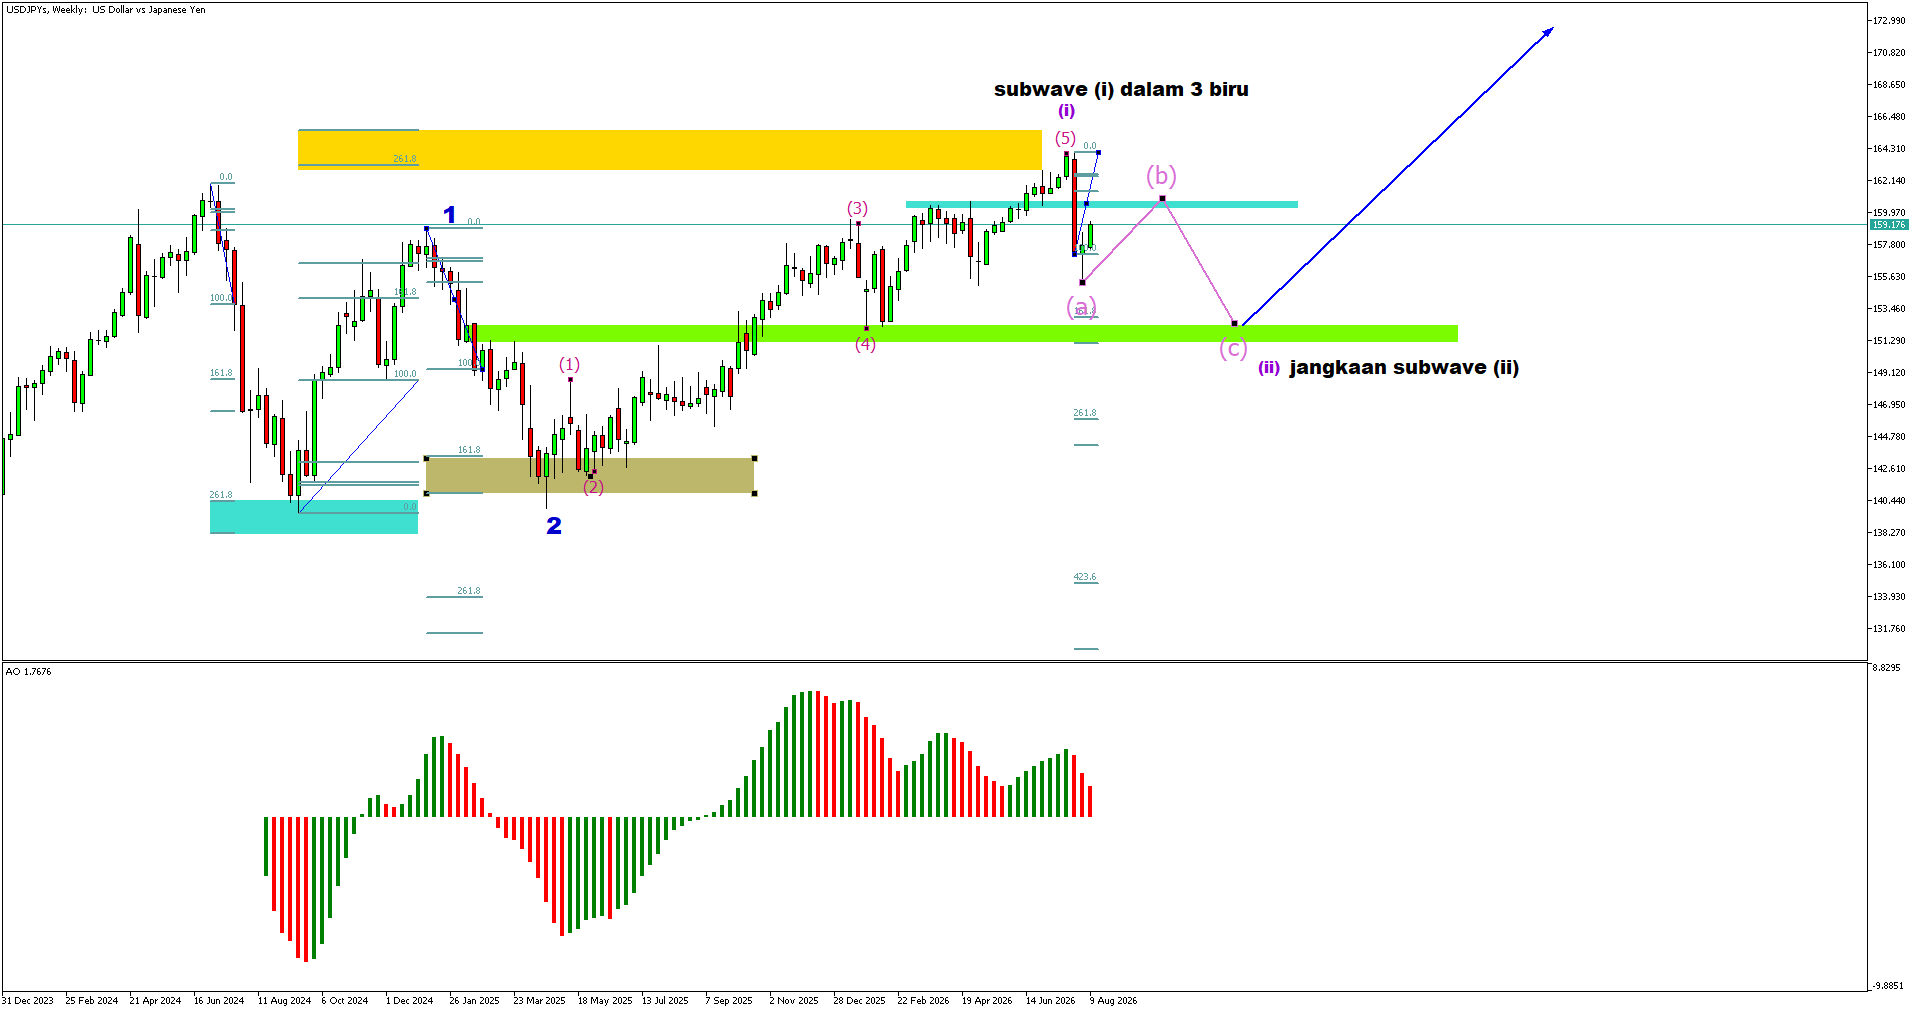
The weekly structure shows a clear bullish progression from the completion of the previous Wave 2.
Price advanced through several internal subdivisions and eventually reached the upper Fibonacci projection zone around the recent high.
The latest movement suggests that Subwave (i) may have reached completion near the highlighted resistance area.
Following this advance, USD/JPY has started to retrace lower, supporting the possibility that a corrective Subwave (ii) is now developing.
The current projection indicates that Subwave (ii) could develop as an ABC corrective structure.
The expected path consists of:
The highlighted green support area around the 151–153 region is particularly important because it could provide the potential completion zone for Subwave (ii).
This area also represents an important structural support level where buyers may potentially return to the market.
The Fibonacci levels marked on the chart provide additional confluence for the current wave projection.
The projected Subwave (ii) correction is expected to move toward the highlighted support zone before the larger bullish trend resumes.
If price reaches this area and produces a strong bullish reaction, it would strengthen the possibility that the corrective phase has completed.
However, traders should wait for confirmation rather than assuming the correction is complete simply because price reaches the Fibonacci zone.
Once Subwave (ii) is completed, the larger bullish structure could resume.
The chart projects a potential continuation toward a new high, with the next major upside objective located around the 172–173 area.
This projection would be consistent with the development of the next bullish subwave within the larger Wave 3 structure.
Therefore, the current decline should be viewed as a potential corrective opportunity rather than an immediate confirmation of a larger bearish reversal.
The Awesome Oscillator remains above the zero line on the weekly timeframe, indicating that the broader momentum structure is still relatively supportive of the bullish scenario.
Although momentum has moderated from its previous peak, the indicator has not yet provided a clear indication of a major bearish trend reversal.
A deeper correction accompanied by weakening momentum would be normal during the development of Subwave (ii).
Traders should monitor the AO closely when price approaches the projected support zone. A bullish momentum recovery from that area would provide additional confirmation for the next potential impulsive move higher.
The preferred scenario remains bullish on the larger timeframe, while expecting a corrective decline in the near term.
The main structure to monitor is:
Subwave (i) completed → ABC correction in Subwave (ii) → bullish continuation toward a new high.
The highlighted support zone around 151–153 is therefore an important area to monitor for potential bullish confirmation.
Traders should look for:
A sustained break below the major support zone would weaken the current Elliott Wave count and require the bullish scenario to be reassessed.
USD/JPY remains structurally bullish on the weekly timeframe, with the latest decline potentially representing Subwave (ii) within a larger bullish Wave 3.
The projected ABC correction could bring price toward the highlighted 151–153 support zone before the next bullish leg develops.
If the support zone holds and bullish momentum returns, USD/JPY could resume its upward movement toward a potential 172–173 target area and establish a new high.
For now, the key focus is not to chase the current movement, but to monitor the completion of Subwave (ii) and wait for confirmation that the larger bullish trend is ready to resume.


USD/CAD is showing signs of a potential bearish reversal after completing a corrective structure on the daily timeframe.

Gold (XAUUSD) continues to trade within a well-defined bearish corrective structure after completing a larger ABC correction.

Get the FXGT App


