Important Note!
We use cookies to ensure you get the best experience on our website.
By clicking ‘Agree,’ you accept our use of cookies as outlined in our cookies policy

Gold (XAUUSD) is currently consolidating inside a contracting triangle on the H4 timeframe after an extended bearish trend. Price action suggests that the market is developing a classic Elliott Wave ABCDE triangle, where each swing becomes progressively smaller before a decisive breakout.
The current structure indicates that Wave (d) may still need to test the lower boundary before the final Wave (e) retests the upper trendline. Once the triangle is completed, the larger bearish trend is expected to resume.
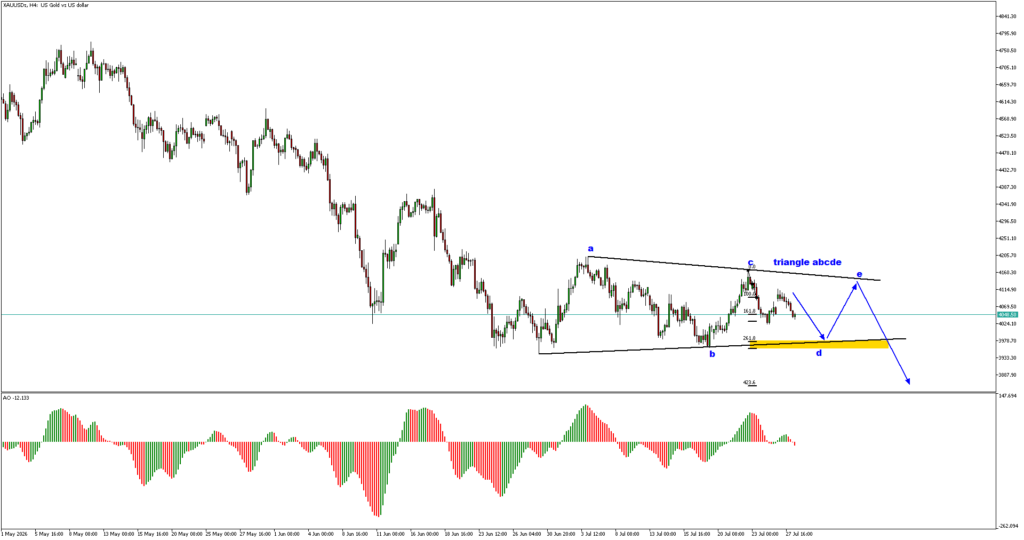
The current price action is unfolding within a symmetrical contracting triangle labelled a-b-c-d-e.
Wave (c) appears to have completed near the descending resistance trendline, while the market is now moving toward the projected Wave (d) support area highlighted in yellow.
If buyers defend this support, a final rebound into Wave (e) is expected, completing the triangle before the next impulsive move.
As long as price remains inside the converging trendlines, the triangle scenario remains valid.
Following the completion of Wave (e), XAUUSD is expected to break below the lower boundary of the triangle, signalling the continuation of the broader bearish trend.
The anticipated downside move would confirm the completion of the triangle pattern and initiate the next impulsive bearish wave.
A decisive breakdown below the triangle support would significantly increase the probability of further selling pressure.
The Awesome Oscillator histogram has weakened considerably, reflecting fading bullish momentum during the current consolidation.
This behaviour is consistent with triangle formations, where momentum typically contracts before a major breakout.
Traders should monitor for a fresh increase in bearish momentum once price exits the triangle, as this would provide additional confirmation of the expected downside continuation.
The preferred scenario is for XAUUSD to complete Wave (d) near the highlighted support zone before rebounding into Wave (e) at the upper trendline.
The final trading opportunity may emerge after Wave (e) finishes and bearish reversal confirmation appears near resistance.
A sustained breakout above the upper triangle boundary would invalidate the current bearish triangle count and suggest that a larger bullish correction is developing.
XAUUSD remains trapped inside a contracting triangle, indicating that the market is preparing for its next major move. The current Elliott Wave count favours the completion of the ABCDE triangle, followed by a bearish breakout below support. Until price escapes the triangle, traders should remain patient and wait for confirmation before positioning for the next directional move.


USDJPY remains under bearish pressure on the Daily timeframe following a sharp rejection from the 163.70–164.00 area.
Gold (XAUUSD) remains in an important corrective phase on the H4 timeframe after the market experienced a sharp decline from the recent high around the 4670–4680 area.

Get the FXGT App


