Important Note!
We use cookies to ensure you get the best experience on our website.
By clicking ‘Agree,’ you accept our use of cookies as outlined in our cookies policy

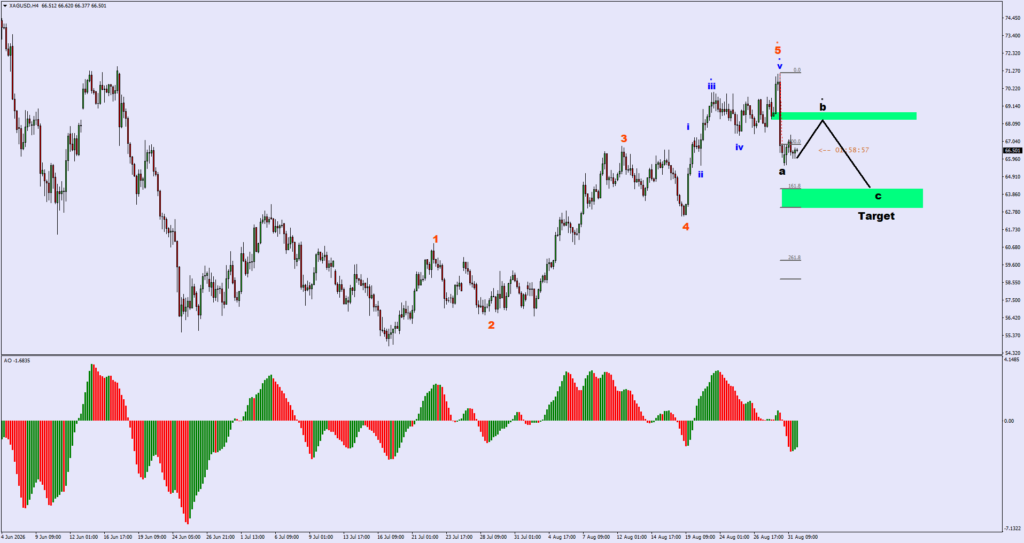
XAGUSD on the H4 timeframe has developed a clear bullish impulsive structure, advancing from the 55.00 area toward the 71.00–71.30 region. The structure appears consistent with an Elliott Wave sequence consisting of Wave 1 through Wave 5.
Price has now shown a sharp reversal after reaching the Wave 5 high. This raises the possibility that the previous five-wave bullish structure has reached a temporary completion and that silver is entering a larger corrective phase.
The preferred scenario suggests the development of an ABC correction, with Wave (a) forming the initial decline, Wave (b) producing a temporary rebound, and Wave (c) potentially extending lower toward the projected support zone.
The major structure on the chart shows a sequence of:
The completion of Wave 5 is particularly important because a five-wave impulsive structure can be followed by a larger corrective phase.
Price has now reversed sharply from the Wave 5 high, suggesting that sellers are beginning to take control in the short term.
Following the Wave 5 peak, XAGUSD experienced a strong decline toward the 66.00 area.
This movement can potentially be classified as Wave (a) of an ABC correction.
The 65.90–66.20 region is therefore an important area to monitor. If price stabilises around this zone and begins to recover, it could indicate that Wave (a) is approaching completion.
However, a decisive break below this area would suggest that the bearish wave may still be extending.
The chart projects a potential rebound following the initial Wave (a) decline.
The green resistance zone around 68.60–69.10 is particularly important because it could become the potential termination area for Wave (b).
A move back toward this region should not automatically be interpreted as a bullish trend reversal.
Instead, if the price action remains corrective, the rebound could simply represent a technical retracement before Wave (c) resumes the downside.
Therefore, rejection within the 68.60–69.10 area would strengthen the ABC correction scenario.
If Wave (b) completes around the projected resistance area, the next expected movement would be Wave (c) to the downside.
The Fibonacci projection on the chart identifies the 63.00–64.00 region as the main potential target zone.
This area is important because it could provide significant support and potentially become the location where the larger ABC correction completes.
A strong bullish reaction from this zone would therefore be worth monitoring for evidence that the corrective structure has reached completion.
The Awesome Oscillator also supports the possibility of a short-term bearish correction.
During the previous bullish advance, AO maintained strong positive momentum. However, momentum began to weaken near the Wave 5 high.
Following the reversal, AO has shifted sharply lower, with the latest histogram bars showing increased bearish momentum.
This indicates that bullish momentum has deteriorated significantly while selling pressure has increased. If AO continues to expand further below the zero line, it would provide additional confirmation that the correction may have further downside potential.
The preferred structure at this stage is:
Wave 5 completion
↓
Wave (a) decline
↓
Wave (b) rebound
↓
Wave (c) decline
↓
Potential completion of the ABC correction
Key Zones
65.90–66.20
Potential Wave (a) support/completion area.
68.60–69.10
Potential Wave (b) resistance zone.
63.00–64.00
Potential Wave (c) target and major support zone.
The correction scenario remains technically relevant as long as price fails to break decisively above the previous Wave 5 high.
The preferred approach is to avoid chasing the initial bearish move after the sharp decline.
Instead, traders can monitor whether XAGUSD produces a corrective rebound toward the 68.60–69.10 resistance zone.
If price reaches this area and produces bearish rejection, it could provide confirmation that Wave (b) has completed and that Wave (c) may be developing.
The potential roadmap is therefore:
66.00 area
→ Wave (a) potential low
68.60–69.10
→ Wave (b) potential rebound
63.00–64.00
→ Wave (c) potential target
A sustained breakout above the Wave 5 high would invalidate or significantly weaken the current corrective scenario and require the Elliott Wave count to be reassessed.
XAGUSD H4 is currently showing signs that the Wave 5 bullish structure may have reached a temporary completion near the 71.00–71.30 region.
The sharp reversal, combined with the deterioration in Awesome Oscillator momentum, supports the possibility of a larger ABC corrective structure.
The preferred scenario is for a potential rebound into 68.60–69.10, representing Wave (b), followed by another bearish leg toward the 63.00–64.00 support zone for Wave (c).
Key takeaway: The current move is potentially a corrective phase rather than the start of a new long-term bearish trend. Watch 68.60–69.10 for Wave (b) resistance and 63.00–64.00 as the major Wave (c) target zone.


Gold (XAUUSD) is showing signs of a significant corrective phase on the H4 timeframe after completing a strong bullish advance.

The USDCAD H4 chart is showing an important potential transition from a prolonged corrective decline into a new bullish Elliott Wave structure.

Get the FXGT App


