Important Note!
We use cookies to ensure you get the best experience on our website.
By clicking ‘Agree,’ you accept our use of cookies as outlined in our cookies policy

GBPUSD is showing signs of renewed weakness on the H4 timeframe after failing to break above a key descending resistance line. The current market structure suggests that the pair may be developing a bearish continuation pattern, with downside targets aligned near the Fibonacci 423 extension zone.
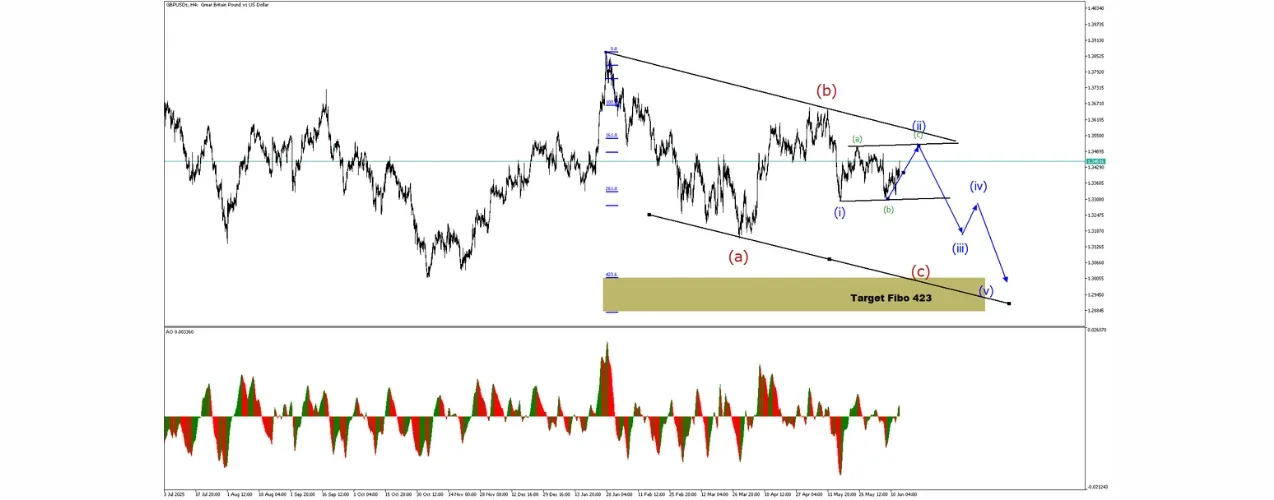
The chart shows a well-defined descending triangle structure, where price continues to form lower highs while testing a relatively stable support base. This pattern typically reflects increasing selling pressure as buyers struggle to regain control.
Recent price action indicates that GBPUSD has once again rejected the descending trendline, reinforcing the bearish outlook. As long as price remains below this resistance, sellers are likely to maintain control of the market.
From an Elliott Wave perspective, GBPUSD appears to be forming a corrective ABC structure within a broader downtrend.
The projected path on the chart suggests that GBPUSD may first attempt a small recovery before resuming its decline toward the lower target zone.
The highlighted Fibonacci 423 extension area represents a major downside target and potential support zone. This level aligns with:
Such confluence increases the probability that price may react strongly once this area is reached.
The Awesome Oscillator (AO) remains near the zero line, indicating that momentum is currently weak and indecisive. However, repeated failures to build bullish momentum suggest that sellers still hold the advantage.
A fresh move into negative territory would strengthen the bearish case and support the expectation of another downward impulse.
The preferred scenario remains bearish while GBPUSD trades below the descending resistance line.
If price breaks below the recent swing low, the bearish structure would gain further confirmation, increasing the likelihood of a move toward the projected target area.
GBPUSD remains vulnerable to further downside pressure on the H4 timeframe. The descending triangle pattern, bearish Elliott Wave structure, and lack of bullish momentum continue to support a bearish outlook.
Traders should monitor the descending resistance line closely. A confirmed rejection from this area may provide opportunities for sellers to target the Fibonacci 423 extension zone and the completion of the current bearish wave structure.


Gold remains under selling pressure on the daily timeframe after breaking below a key support area and continuing to trade within a broader corrective structure. The curr...

AUDUSD is showing increasing signs of weakness after breaking below a key support level, which has now turned into a potential resistance area. The current market structu...


