Important Note!
We use cookies to ensure you get the best experience on our website.
By clicking ‘Agree,’ you accept our use of cookies as outlined in our cookies policy

Bitcoin has reached a key resistance zone after completing a corrective recovery from its recent low. Price is now testing the Fibonacci 261.8 extension area, which coincides with a projected Wave (iv) completion zone. The market structure suggests that BTCUSD may be approaching the end of its corrective rally before resuming the broader bearish trend.
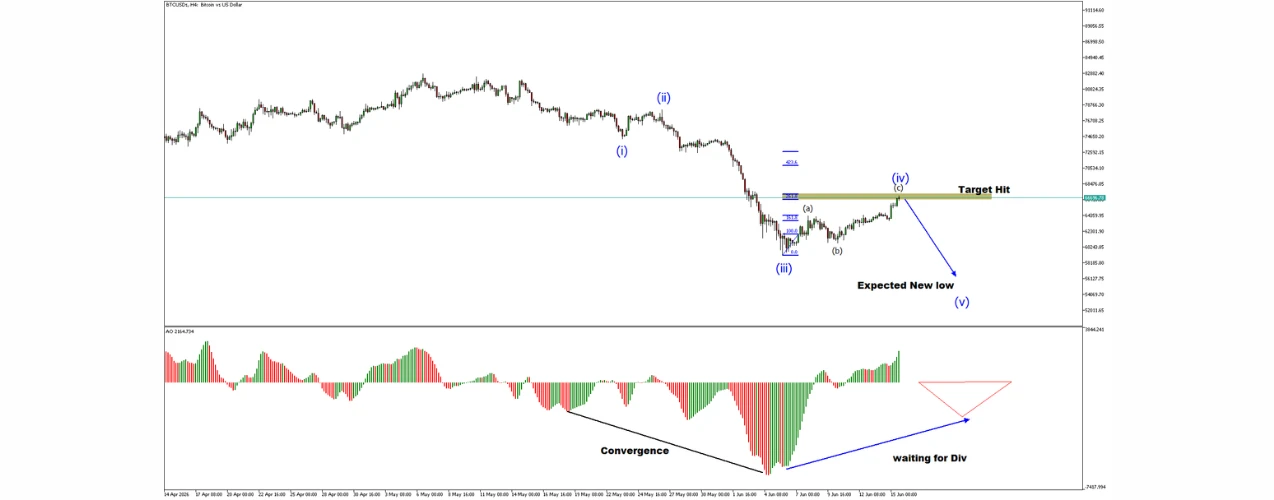
The chart shows a completed decline from Wave (ii) into Wave (iii), followed by a corrective advance labelled as Wave (iv). Price has now reached the projected resistance area near the Fibonacci 261.8 extension, where selling pressure may begin to emerge.
The current advance appears corrective rather than impulsive, suggesting that buyers are losing momentum as the market approaches a critical decision point.
According to the current Elliott Wave count, the market has likely completed:
If this count remains valid, Bitcoin could soon begin Wave (v), which would represent the final bearish leg of the current cycle.
The projected path suggests that a rejection from the current resistance zone could trigger a fresh decline toward new lows.
The AO (Awesome Oscillator) indicator continues to display bullish convergence.
While price created a lower low during Wave (iii), momentum failed to confirm the weakness, indicating that bearish momentum is slowing.
However, the chart annotation highlights “Waiting for Divergence,” meaning traders should monitor whether the current Wave (iv) rally produces bearish divergence before entering short positions.
Immediate resistance is located around the Fibonacci 261.8 extension zone, where Wave (iv) is expected to complete.
A confirmed rejection from this area could open the door for:
The bearish scenario remains valid as long as price fails to establish a sustained breakout above the current resistance zone.
Bitcoin is currently testing a critical resistance area after completing a corrective recovery. The Elliott Wave structure suggests that Wave (iv) may be nearing completion, while momentum indicators warn that the rally could be losing strength.
Traders should closely monitor price action around the current resistance zone. A bearish rejection could confirm the beginning of Wave (v), potentially leading to a fresh move toward lower price levels in the sessions ahead.


Introduction Crypto markets are showing a mix of recovery signals, regulatory progress, and lingering caution. Bitcoin is attempting to stabilize after a sharp correction...


GBPUSD is showing signs of renewed weakness on the H4 timeframe after failing to break above a key descending resistance line. The current market structure suggests that ...


