Important Note!
We use cookies to ensure you get the best experience on our website.
By clicking ‘Agree,’ you accept our use of cookies as outlined in our cookies policy

Bitcoin continues to trade within a broader bearish trend after completing a strong impulsive decline from the wave (ii) high. Following the completion of wave (iii), price has entered a corrective recovery phase that appears to be developing as wave (iv).
The current rebound remains corrective in nature and has yet to invalidate the prevailing bearish outlook.
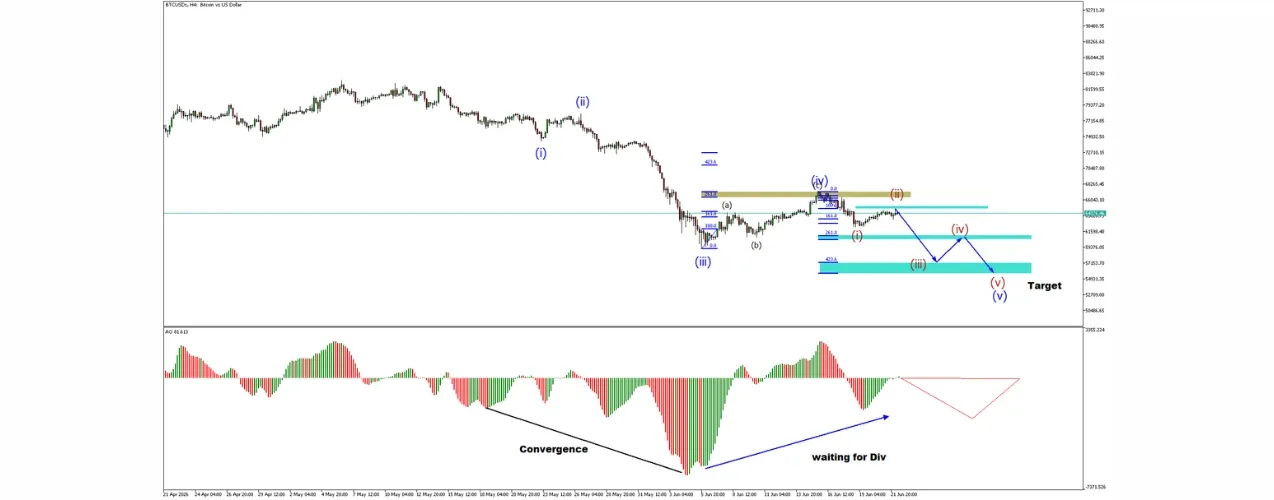
The chart indicates that Bitcoin may have completed waves (i), (ii), and (iii) of a larger bearish sequence.
The current structure suggests:
The highlighted resistance zone near the wave (iv) area remains a key region to monitor for bearish rejection.
Price is currently approaching an important resistance cluster that aligns with previous support-turned-resistance levels and Fibonacci retracement projections.
Failure to break above this zone would reinforce the bearish scenario and increase the probability of wave (v) beginning from current levels.
A decisive breakout above resistance would delay the bearish outlook and suggest a more complex correction is developing.
The Awesome Oscillator (AO) continues to display convergence characteristics, indicating that downside momentum has weakened compared with the previous decline.
However, bullish divergence has not yet been fully confirmed. Traders should continue monitoring momentum behaviour for confirmation before anticipating a larger corrective recovery.
Until a confirmed divergence develops, the dominant trend remains bearish.
The preferred scenario remains bearish while the current corrective rebound stays below the highlighted resistance zone.
A rejection from the wave (iv) area could trigger the next impulsive decline, with wave (v) expected to drive Bitcoin toward new lows and complete the broader five-wave bearish structure.
Bitcoin is currently undergoing a corrective rebound following the completion of wave (iii). While momentum indicators suggest downside pressure is easing, the broader Elliott Wave structure continues to favour another bearish leg lower.
Traders should closely monitor price action around the resistance zone, as a rejection from this area could provide confirmation that wave (v) is beginning.
Trading Outlook: Bearish below the wave (iv) resistance zone, with expectations for wave (v) to extend toward fresh lows.


Introduction Crypto markets remain under pressure as Bitcoin struggles to regain momentum and Ethereum faces fresh concerns of its own. Bitcoin’s price weakness has...


US30 Faces Strong Resistance at Key Swap Zone US30 is currently trading within a corrective structure after a sharp impulsive decline from the recent high. Price has rebo...


