Important Note!
We use cookies to ensure you get the best experience on our website.
By clicking ‘Agree,’ you accept our use of cookies as outlined in our cookies policy

AUD/USD continues to recover from its recent decline, but the current rally appears corrective rather than the beginning of a new bullish trend. Elliott Wave structure, Fibonacci resistance, and Awesome Oscillator (AO) divergence indicate that buyers are approaching a high-risk resistance area where selling pressure could return.
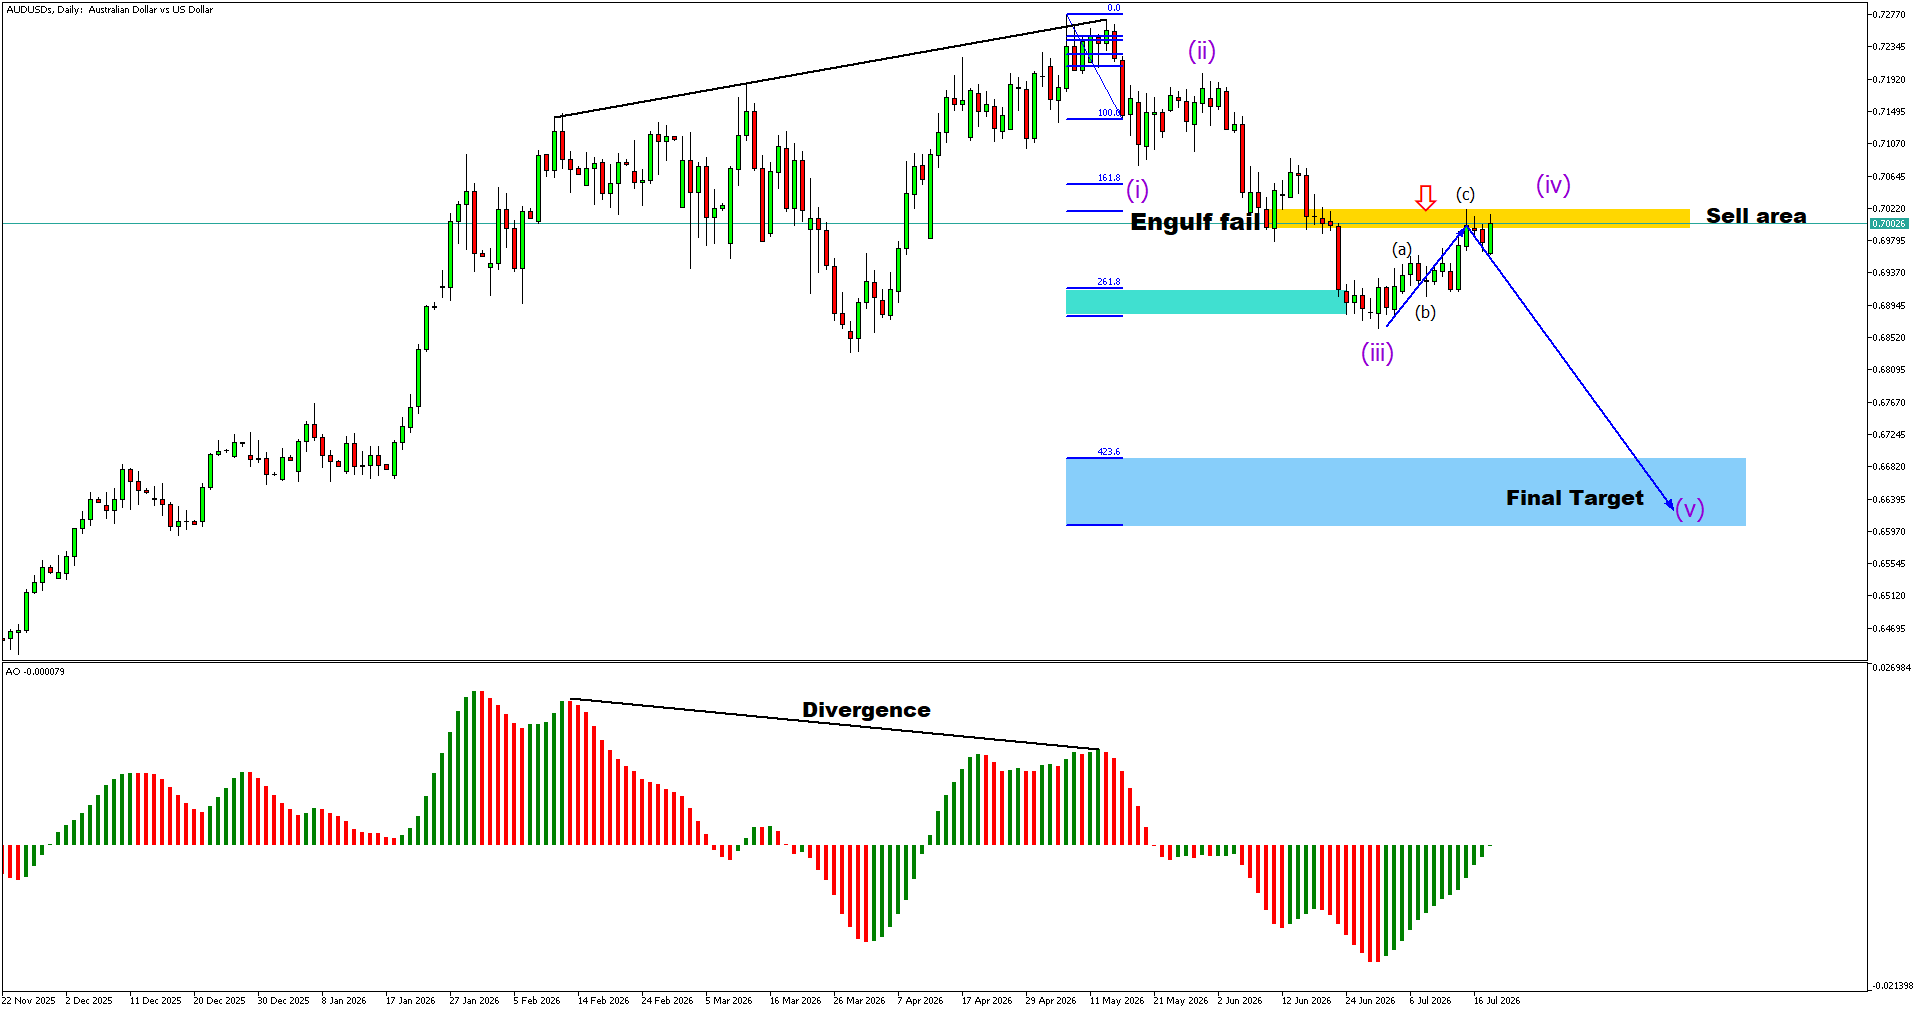
The chart suggests that AUD/USD has completed a five-wave bearish impulse before beginning an ABC corrective recovery.
The current advance is likely forming Wave (c), which is approaching a significant Fibonacci resistance cluster around the highlighted sell zone. This area also coincides with previous support that has now become resistance.
If sellers successfully defend this zone, the corrective structure could be completed before the larger downtrend resumes.
The Awesome Oscillator previously formed a bearish divergence during the major top, accurately warning of weakening bullish momentum.
Although momentum has improved during the current rebound, the histogram remains relatively weak compared to previous bullish swings.
This suggests the current recovery is driven more by short-covering than by strong buying conviction.
The highlighted resistance area represents the most important technical level for the coming sessions.
This zone combines:
Failure to break above this resistance would significantly increase the probability of another bearish leg.
The preferred scenario is for AUD/USD to complete Wave (c) inside the highlighted sell zone before reversing lower.
A confirmed bearish rejection could initiate the next impulsive decline toward the projected blue target area, completing the larger Wave (v).
However, a decisive daily close above the sell zone would invalidate the current bearish outlook and require a reassessment of the wave count.
AUD/USD remains inside a corrective recovery, but technical evidence continues to favour the broader bearish trend. Traders should closely monitor price action around the highlighted resistance area, as it could determine the next major directional move. A bearish rejection from this zone would reinforce the probability of a continuation toward the projected downside target.


Gold (XAUUSD) is currently showing signs of a potential recovery after experiencing a sharp corrective decline from the recent high area.

Gold (XAUUSD) on the H4 timeframe is showing signs of a significant corrective phase following the strong bullish advance seen throughout August.

Get the FXGT App


